
Bookkeeping fundamentals
Inventory Bookkeeping for Small Product Businesses: The Hidden Tax on Your Shelves
Inventory is the quietest line on the balance sheet and the loudest drain on cash flow. Carrying costs of 20-30%, $1.2 trillion lost to stockouts, costing methods that move reported profit, and the bookkeeper's monthly rhythm that keeps it all honest — with a worked example.

The short answer

Inventory bookkeeping is the discipline of tracking what a product business owns on its shelves, what it costs to keep it there, and what it truly cost to sell each unit. It is the only part of a product business's books where the balance sheet and the warehouse have to agree — and where they disagree most often. A small product business that buys $300,000 of goods and sells them for $450,000 can still be bleeding cash if $100,000 of it is sitting in dead stock at a 25% carrying cost, if the wrong costing method is flattering or punishing reported profit, and if shrink is eating 1-2% of sales before anyone notices.
The data says this is the norm, not the exception. The industry benchmark for annual inventory carrying cost is 20-30% of inventory value. The typical small or mid-sized business turns its inventory about four times a year. A quarter of surveyed SMBs report more than 10% of their inventory as dead stock — doubled in two years. And stockouts alone drain roughly $1.2 trillion from global retail every year.
This article covers the carrying-cost math every product business should run, the three accounts that carry the whole system, how FIFO, LIFO, and weighted-average costing change reported profit on identical sales, why overstocks and stockouts are really the same disease, what shrinkage data says about theft and errors, and the bookkeeper's monthly rhythm — the counts, reconciliations, and journal entries that keep inventory honest.
The hidden tax on your shelves: carrying cost
When a product business owner looks at a $40,000 inventory, they see $40,000 of product. The bookkeeper sees $40,000 of product plus a recurring bill. Industry research consistently puts annual inventory carrying cost at roughly 20-30% of inventory value: the capital tied up in the stock, the space to store it, the insurance and taxes on it, and the risk that it goes obsolete, gets damaged, or walks out the door. AccountingTools describes about 20% as a common benchmark. Impact Analytics, citing APQC benchmarking data, puts the all-in figure at 20-30%. Shopify's 2026 retail benchmark lands in the same 20-30% range, with fashion and home goods running higher because of markdowns and storage needs. OpenSend's e-commerce data adds a small-business twist: operations under $1 million of annual revenue typically run 25-30%, while enterprise operations land at 15-20% — weaker buying power and less sophisticated systems cost small firms a premium.
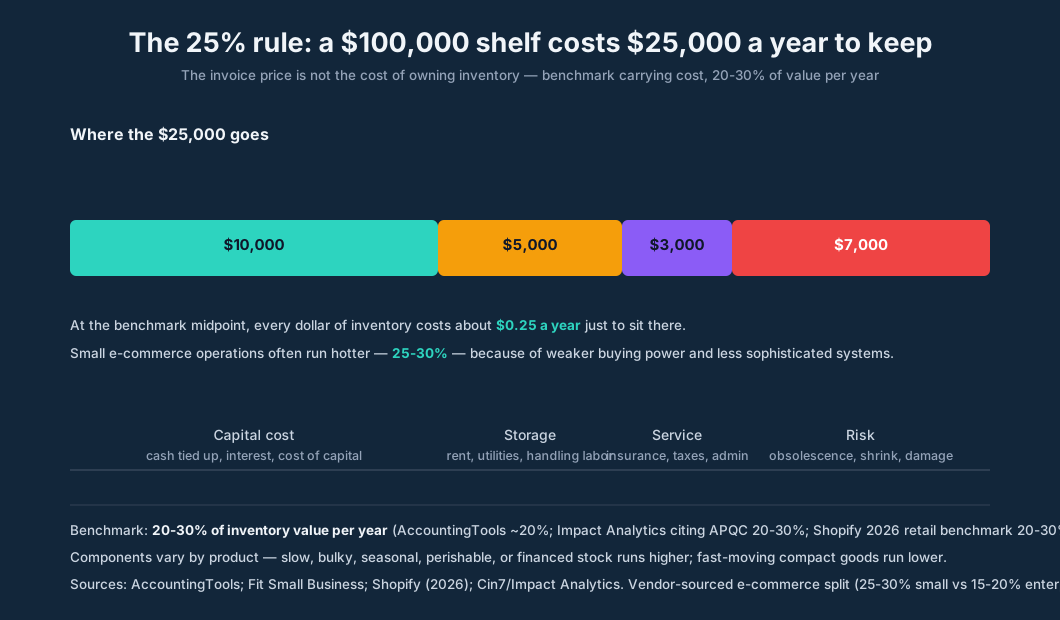
Make it concrete. Take "Blue Cedar Home Goods," a small candle and home-fragrance maker with $300,000 of annual revenue and average inventory of $40,000:
- Carrying cost at 25%: $10,000 per year — $833 a month — for inventory that has not sold a single unit.
- If the business earns a 15% net margin, its annual profit is $45,000. The carrying cost eats 22% of that profit before anything goes wrong — no markdowns, no dead stock, no theft. Just owning the inventory.
That is the carrying-cost argument in one number: every dollar of inventory costs about 25 cents a year to own. Cutting average inventory from $40,000 to $30,000 without hurting sales saves $2,500 a year in carrying cost alone — before counting the cash freed up. Inventory reduction is often the cheapest "loan" a small business will ever take.
The three accounts that carry the whole system
Every product business's inventory accounting rests on three general-ledger accounts, and the most common inventory bookkeeping failures are failures to keep these three consistent:
- Inventory (current asset). What you own and have not sold. Valued at cost — what you paid for it, including freight in — not at what you hope to sell it for. It sits on the balance sheet, and it should be reconcilable to what is physically on the shelves.
- Cost of Goods Sold (expense). What you paid for the units you actually sold this period. Every sale moves cost out of the asset account and into this expense account. It is the line that determines gross margin.
- Purchases (temporary account, periodic systems only). A holding account for inventory bought during the period, closed into COGS at period end.
The relationship between them is the single most important inventory formula in bookkeeping: COGS = beginning inventory + purchases − ending inventory. Everything else — every costing method, every count, every reconciliation — is a way of making the "ending inventory" number trustworthy.
Perpetual vs. periodic: two ways to keep the books
The system a business uses determines when COGS gets recorded and how much anyone knows mid-period:
| Factor | Periodic inventory | Perpetual inventory |
|---|---|---|
| Records update | At scheduled physical counts | After every transaction |
| COGS timing | Calculated at period end (BI + purchases − EI) | Updated after each sale |
| Technology required | Minimal; spreadsheets work | POS and inventory software |
| Upfront cost | Low | Higher |
| Cycle counting | Not possible (no live balances) | Supported |
| Best-fit business | Small, low-SKU operations | Growing, multi-channel, multi-location |
A periodic system is honest and cheap, but it is blind between counts: for eleven months of the year, the business cannot see current COGS, cannot compute true gross margin, and cannot tell which products are actually profitable. A perpetual system records two entries on every sale — one for the revenue, one moving the cost from inventory to COGS — so margins stay current. The tradeoff is upkeep: perpetual tracking needs POS or inventory software and disciplined receiving. Most firms graduate clients from periodic to perpetual somewhere around the second location or the 200th SKU.
Costing methods: the choice that changes your reported profit
When every unit costs the same, inventory bookkeeping is arithmetic. When costs change — and they always change — the business must choose a cost flow assumption: which cost leaves the inventory account when a unit sells. The four methods:
- FIFO (first in, first out): the oldest units are assumed sold first. Ending inventory reflects the most recent costs.
- LIFO (last in, first out): the newest units are assumed sold first. COGS reflects the most recent costs.
- Weighted average: every receipt re-computes a blended unit cost; sales go out at the average.
- Specific identification: each unit's actual cost is tracked. Accurate, but only practical for unique, high-value items (vehicles, art, custom equipment).
In rising prices, the methods diverge in predictable ways: FIFO reports the highest profit (old cheap costs flow to COGS, new expensive costs sit in inventory), LIFO reports the lowest profit (new expensive costs hit COGS immediately), and weighted average lands in the middle. LIFO is the most honest matching of current costs to current revenues — and also the one with a regulatory asterisk: LIFO is permitted under U.S. GAAP (ASC 330) but explicitly prohibited under IFRS (IAS 2). A business operating internationally or converting to IFRS cannot use it. Whichever method a business chooses must be applied consistently and disclosed — comparability matters more than the method itself.
The worked example: same shelf, three profits
Two lots of the same product: 100 units at $10 ($1,000), then 100 units at $12 ($1,200). Sell 150 units at $25 each for $3,750 of revenue. The cash is identical in all three scenarios:
| Method | COGS | Ending inventory | Gross profit |
|---|---|---|---|
| FIFO | $1,600 | $600 | $2,150 |
| Weighted average | $1,650 | $550 | $2,100 |
| LIFO | $1,700 | $500 | $2,050 |
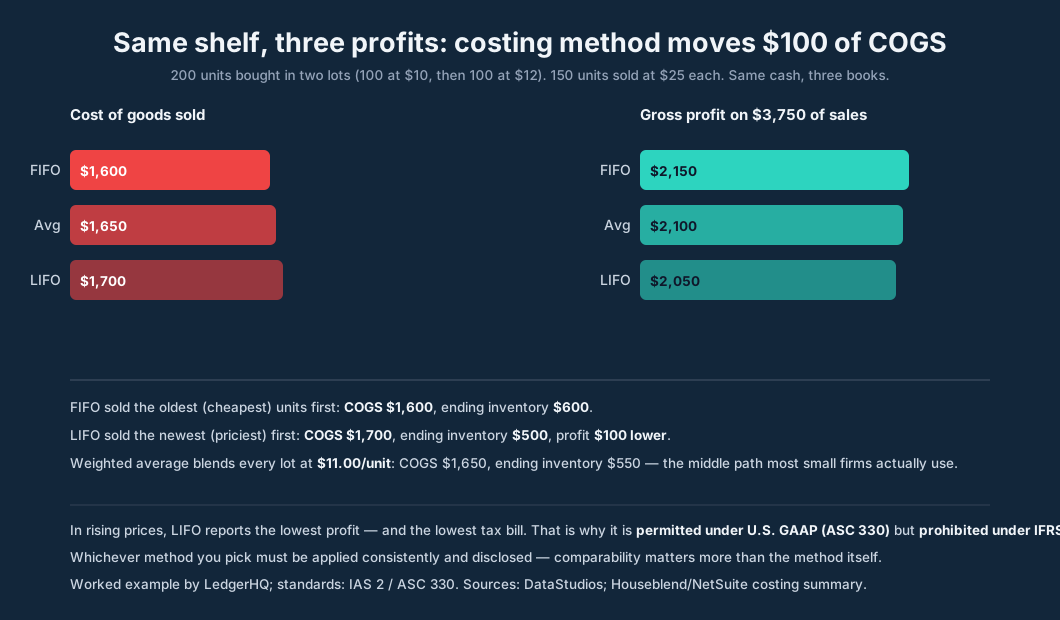
The FIFO books look $100 more profitable than the LIFO books on the exact same sales. That $100 swing moves the income statement, the tax return (in the U.S., LIFO defers tax in inflationary periods), the balance sheet's inventory value, and every margin-based decision the owner makes. Now scale it to a business buying $2 million of goods a year with rising supplier prices: the method choice can move reported profit by tens of thousands of dollars with no change in cash. This is why costing method is a firm decision, not an afterthought — and why the bookkeeper documents it, discloses it, and applies it the same way every period.
Overstocked: when inventory stops moving
The most expensive inventory is inventory that never sells. Netstock's 2026 Supply Chain Planning Benchmark Report — platform data from more than 2,500 small and mid-sized businesses plus a survey of 150+ — found the typical business now turns its inventory about four times a year, a three-year high, with top performers reaching seven turns. But in the same report, 24% of SMBs said more than 10% of their inventory was dead stock — inventory that has stopped selling entirely — up from just 12% in 2024. The dead-stock share doubled in two years while turns improved: the fastest-moving businesses are also the ones stuck with the most product that won't move at all.
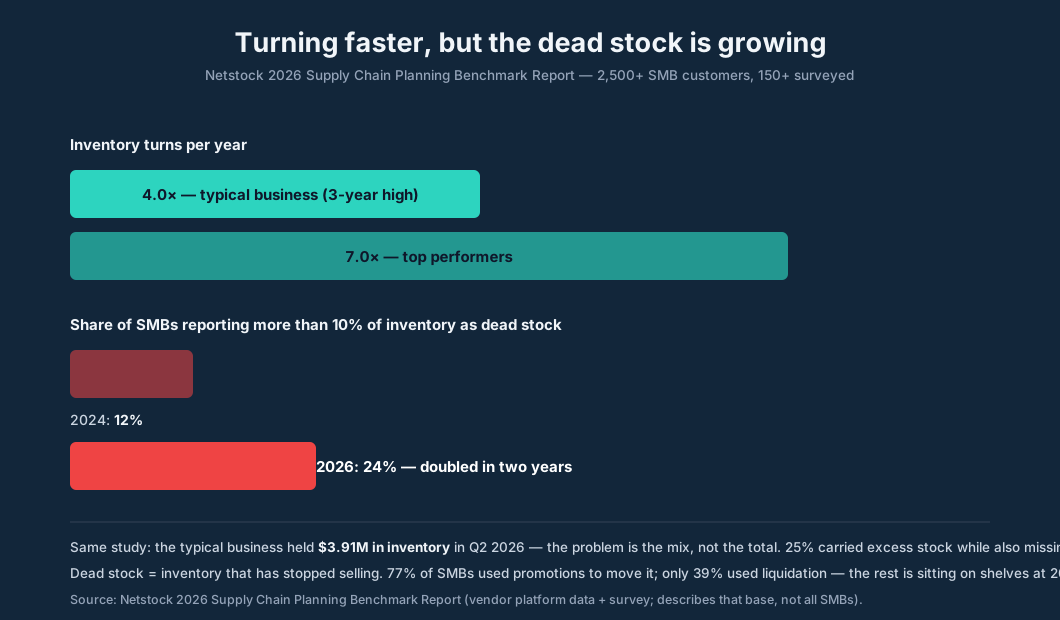
The same study sharpens the point: the typical business held $3.91 million in inventory in the second quarter of 2026, and 25% of customers carried excess inventory while also missing sales. That is the signature of a broken inventory mix — too much of what customers don't want, too little of what they do. Businesses tried to move the excess: 77% used promotions or sales, 39% turned to liquidation. But promotions and liquidation only clear products that still have buyers; dead stock is, by definition, past that. Every month it sits, it accrues that 20-30% carrying cost — a $10,000 dead pile costs $200-250 a month to keep on the shelf.
The bookkeeper's job here is not to forecast demand; it is to make the dead stock visible. Run the aging: any SKU with no sales in 90 days gets flagged, any SKU with no sales in 180 days gets a write-down conversation. Inventory carried at the lower of cost or market means obsolete inventory must be written down — the write-down is a real hit to the current period, and that is exactly the point. Businesses that delay the write-down carry fiction on their balance sheets; businesses that take it promptly can stop carrying the tax.
Understocked: the $1.2 trillion cost of empty shelves
Overstocks freeze cash; stockouts burn it. IHL Group's 2025 analysis put the global cost of out-of-stocks at roughly $1.2 trillion per year, part of about $1.7 trillion in what the firm calls inventory distortion — the combined drag of empty shelves and excess stock, equal to 6.2% of worldwide retail sales. That is an update of IHL's landmark 2015 study, which estimated $1.75 trillion a year split across $471.9 billion in overstocks, $634.1 billion in out-of-stocks, and $642.6 billion in preventable returns.
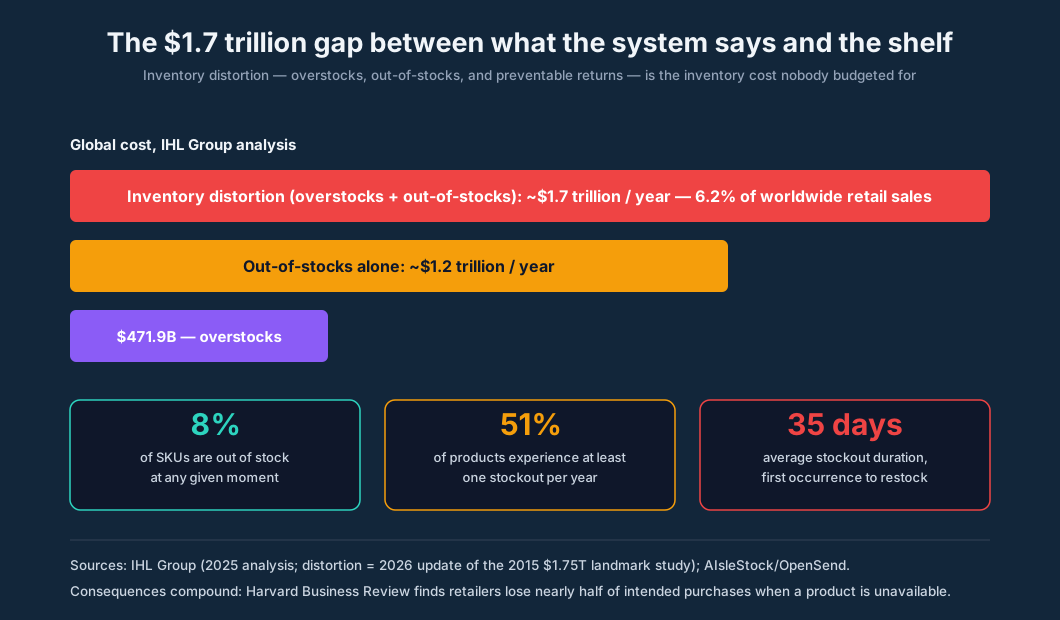
The per-order numbers are just as stark: industry research compiled by AIsleStock and OpenSend finds 8% of SKUs out of stock at any given moment, 51% of products experiencing at least one stockout per year, and the average stockout lasting 35 days from first occurrence to full replenishment — more than a month of a product sitting at zero while customers look for it. Harvard Business Review's research finds that retailers lose nearly half of all intended purchases when a product is unavailable. And a 2023 PwC report found that 32% of customers stop doing business with a brand they love after just one bad experience — an empty shelf is one bad experience.
For a small product business, the stockout math is simpler and more brutal: one stockout on a bestseller does not just lose that order. It loses the basket the order was in, the repeat purchase that follows a satisfied first purchase, and sometimes the customer. The bookkeeper's defense is the same as the overstock defense, in reverse: visibility. Reorder points — order-quantity and lead-time math, not gut feel — set before the shelf goes empty, reviewed when sales velocity changes, and adjusted for the supplier who ships in three weeks versus the one who ships tomorrow.
Shrink and accuracy: what disappears between counts
Shrink — the gap between what the books say is on hand and what is actually there — is the inventory cost that compounds silently. The National Retail Federation's 2023 National Retail Security Survey, the final edition of that study, put U.S. retail shrink at 1.6% of sales, or $112.1 billion in fiscal 2022, with theft by outsiders and employees together accounting for about 65% of it (external theft alone roughly 36%). Small retailers feel it worse: an NRF and Software Advice survey found 68% of SMB retailers experiencing shrink rates above the 1.5% industry standard, and 34% reported shrink rising over the prior 12 months. (One caveat the industry itself notes: the NRF later retracted its frequently cited $45 billion organized-retail-crime figure, saying the problem is real but harder to quantify than first stated.)
Shrink is not only theft. Administrative errors, vendor mispicks, damage, and mis-shipments all land in the same gap — and that gap starts with bad records. The Auburn University RFID Lab puts the average retailer's inventory record accuracy at just 63%. Aggregated survey data from Wasp Barcode finds 43% of small businesses either don't track inventory or use manual methods. And vendor surveys report that 34% of businesses have shipped an order late because they sold a product that wasn't actually in stock.
The practical fix is the count — and more importantly, the kind of count. A single annual physical count lets discrepancies pile up for twelve months before anyone notices. Cycle counting — counting a portion of the stock on a rolling schedule all year, with high-value "A" items counted often, "B" items less often, and slow "C" items least often — catches problems while they are still small. Vendor research from Tractian, cited by Cin7, puts disciplined cycle counting at 98-99% inventory accuracy, and Fishbowl's customer data for 2025 shows a 22% decrease in stockouts after businesses tightened their counts. For the small product business, ABC cycle counting is the highest-return inventory control that exists: a few hours a week of counting, and the books finally match the shelves.
The bookkeeper's monthly inventory rhythm
Inventory bookkeeping is a monthly rhythm, not a year-end project. The firms that keep it honest run the same five steps every month:
- Reconcile the inventory account to the subledger. The general-ledger inventory balance must tie to the inventory system's valuation report, and the difference must have a name — in-transit, damaged, or a count adjustment — not a shrug. A gap with no name is where margin goes to die.
- Age the inventory. Flag SKUs with no sales in 90 days; push the 180-day-plus pile toward write-down. Obsolete inventory carried at cost is the quietest lie on the balance sheet.
- Review the costing method and its math. One receipt posted to the wrong cost layer poisons every later sale's COGS. Spot-check a few sales: does the COGS per unit match the method's current layer or average?
- Count something. A cycle-count schedule by ABC class, with variances investigated and adjusted the same week — not filed until the annual count.
- Reconcile purchases to supplier statements. Every receipt should have a matching purchase. The purchase clearing account — if the firm uses one — should net to zero; a balance in it means goods received without invoices, or invoices without goods.
The journal entries behind the rhythm are simple double-entry. A purchase under the perpetual system:
Debit Inventory $1,200 / Credit Accounts Payable $1,200
And a sale records both sides of the transaction — the revenue and the cost leaving the asset:
Debit Cash (or A/R) $3,750 / Credit Revenue $3,750 Debit COGS $1,650 / Credit Inventory $1,650
A physical-count adjustment that finds $400 less than the books requires:
Debit COGS (or a dedicated shrink/inventory-adjustment account) $400 / Credit Inventory $400
Post the adjustment to its own account, not buried in COGS, and shrink becomes a visible monthly number the owner can actually manage. That visibility is the whole point: what gets its own line gets fixed.
Where LedgerHQ fits — and where it does not
An honest accounting-tool article says what the tool is not. LedgerHQ is not a warehouse management system: it does not hold per-SKU valuation layers, reorder points, or shelf counts — there is no inventory subledger in the product, and the firm should not pretend otherwise. SKU-level detail lives in dedicated inventory tooling or a well-run POS; the firm posts the summary truth to the general ledger as balanced journal entries, the way double-entry accounting was designed.
What LedgerHQ keeps honest is everything around the inventory accounts. The firm builds the chart of accounts — Inventory as a current asset, COGS and purchase accounts on the income statement, a dedicated shrink-adjustment account — and reads each account's register with its running balance to spot drift early. Every inventory adjustment, count variance, and write-down lands as a balanced manual journal entry: draft it, post it, and if it turns out wrong, edit or void the posted entry rather than layering correcting entries on top of mistakes. The monthly review rhythm — reports, registers, bank feeds, statements, bank recs, open client questions — is the natural home for the inventory reconciliation. Income-statement reports run in accrual or cash basis, drill from any account down to the source entries, and export as client-ready PDF or spreadsheet; class columns let a multi-product business compare income and expense across product lines or locations and review profit by class. Purchases land through bank feeds that post continuously, with the source document kept beside every transaction, and Tally — the AI assistant — reviews anomalies the way a skeptical CFO would: a COGS entry with no matching receipt, a sudden inventory balance swing, a count adjustment nobody explained. LedgerHQ runs $20 a month per business, with the Free Preview open through January 1, 2027.
The division of labor is clean: the inventory system knows the units; LedgerHQ knows the money; the bookkeeper makes the two agree every month. That monthly agreement — GL inventory to subledger, counts to records, purchases to statements — is inventory bookkeeping. Everything else is reporting.
Frequently asked questions
Should a small product business use FIFO, LIFO, or weighted average? For most small U.S. product businesses, FIFO or weighted average. FIFO matches the physical reality of perishable and dated goods and is permitted under both GAAP and IFRS; weighted average is the simplest defensible choice for commodity-style goods with frequently changing costs. LIFO can defer taxes in inflationary periods under U.S. GAAP, but it is prohibited under IFRS, complicates comparisons, and is rarely worth the complexity for a small business. Pick one, disclose it, and stay consistent.
How often should a small business count inventory? A full wall-to-wall count at least once a year, plus rolling cycle counts all year — A items weekly or monthly, B items quarterly, C items once or twice a year. Annual-only counting lets twelve months of discrepancies compound into one unexplainable adjustment.
What is a good inventory turnover ratio for a small product business? It depends entirely on the product: fashion and perishables need much faster turns than furniture or equipment. Netstock's 2026 data puts the typical SMB at about 4 turns a year with top performers at 7 — a useful starting benchmark, not a target. Compare against your own history and your industry; the trend matters more than the level.
How do you book inventory shrinkage? Post the shortage to its own expense account — not buried in COGS — when the count variance is confirmed: debit the shrink/inventory-adjustment account, credit inventory. A visible monthly shrink number is what makes shrink manageable; a number hidden inside COGS just flattens gross margin and teaches nobody anything.
Can a service business have inventory? Yes, in a limited sense: supplies held for use in client work, and any products the firm resells, are inventory for bookkeeping purposes. Pure service labor has no inventory — and no COGS in the merchandising sense — which is exactly why product businesses carry an extra bookkeeping discipline their service peers don't.
When does a periodic system stop being enough? Roughly when the business can't answer "what did we make on this product last month" without a full count: multiple locations, multiple sales channels, 200-plus SKUs, or the need for current margin data to price and promote. The cost of delayed inventory data eventually exceeds the cost of the software.
Sources
- Netstock, "2026 Supply Chain Planning Benchmark Report" (2026) — netstock.com
- Supply Chain 24/7, "One in Four Small Businesses Reports High Dead Stock, Study Finds" (2026) — supplychain247.com
- IHL Group 2025 analysis / retail-insight-network, "How overstock, stockouts, and returns cost retail $1.75tn" (2026) — retail-insight-network.com
- AIsleStock / OpenSend, "72% of Stockouts Are Preventable: 2026 Out-of-Stock Data" — vndly.io
- Mirakl, "The $1.2T problem: Why out-of-stocks are crushing retailers" — mirakl.com
- Prediko, "What Are Stockout Costs? Impact, Examples & How to Avoid Them" — prediko.io
- Vndly, "20% Inventory Carrying Costs: 2026 Data & Ways to Cut Them" (2026) — vndly.io
- Shopify, "Inventory Costs: Calculation and Reduction Guide" (2026) — shopify.com
- OpenSend, "7 Inventory Carrying Cost Statistics For eCommerce Stores" — opensend.com
- Xorosoft, "Inventory Carrying Cost Statistics & Benchmarks 2026" — xorosoft.com
- Guardian Alarm, "Retail Shrink Statistics Every Store Owner Should Know" (2026) — guardianalarm.com
- InVue, "6 Retail Shrinkage Statistics Every Loss Prevention Leader Should Know" — invue.com
- DC Velocity, "NRF: shrinkage continues to rise, but crime rate is difficult to quantify" — dcvelocity.com
- Retail Insight Network, "Small retailers face theft and inventory shrink in US" — retail-insight-network.com
- Dropship Spy, "33+ Crucial Inventory Management Statistics for E-commerce" — dropship-spy.com
- Crestmont Capital, "Inventory Cost Benchmarks by Industry: What Small Business Owners Need to Know in 2026" — crestmontcapital.com
- ProfileTree, "Unveiling Key Inventory Management Statistics" — profiletree.com
- DataStudios, "How Inventory (FIFO, LIFO, Weighted-Average) Appears on the Balance Sheet" — datastudios.org
- Houseblend, "NetSuite Inventory Costing: Average, FIFO, LIFO & Standard" — houseblend.io
- FundsNet, "Inventory Costing Method" — fundsnetservices.com
- Testbook, "Which inventory valuation method is permitted under US GAAP but prohibited under IFRS?" — testbook.com
- Fishbowl Inventory, "Periodic vs Perpetual Inventory: How to Choose" — fishbowlinventory.com
- Cin7, "Inventory Management Software Features: A 2026 Guide" — cin7.com
- LedgerHQ Docs, "Accounting and reports" / "Reports" / "Period review and fiscal-year protection" (verified October 2026) — ledgerhq.pro/docs