
Firm operations
Job Costing for Contractors and Trades: A Bookkeeper's Guide
Most contractors don't lose money on the job they watch — they lose it on the job they didn't measure. How job costing works, why labor burden quietly destroys bids, a worked $180,000 remodel that lost money at '10.8% margin,' and the bookkeeper's checklist for running the numbers.

The short answer

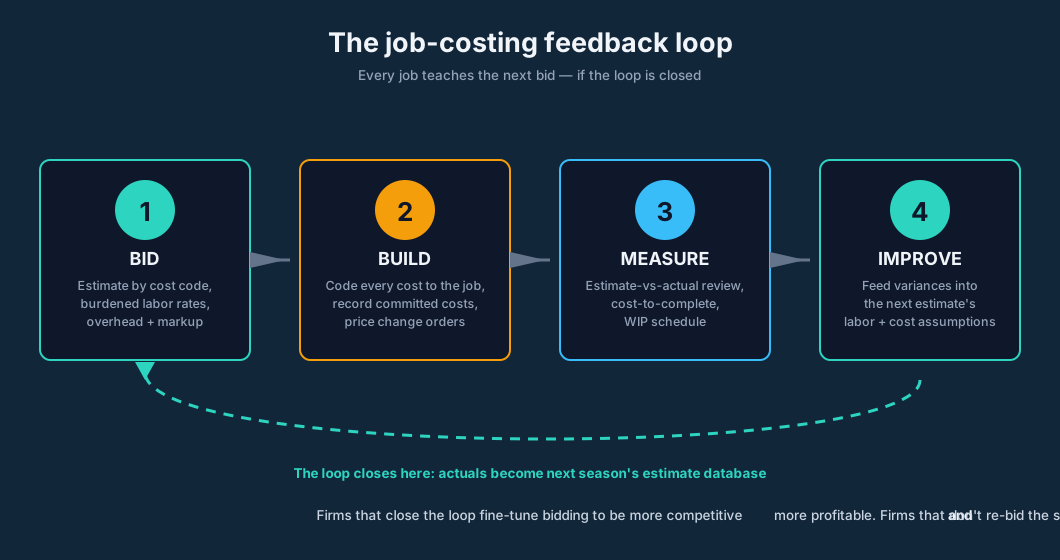
Job costing is the practice of tracking every dollar — labor, materials, subcontractors, equipment — against the specific job it belongs to, not just against the company as a whole. A contractor can be "profitable" company-wide and still bleed cash on individual jobs, because company-level books hide which jobs paid for overhead and which jobs quietly ate it. The firms that survive on single-digit net margins run job costing as a monthly (often weekly) discipline: every job gets a budget, actuals get coded to the job as they land, the estimate-vs-actual report gets reviewed before the next invoice goes out, and the lessons go straight into the next bid.
This article covers the margin math that makes job costing a survival skill, the five cost buckets every contractor has to track, the labor-burden trap that destroys more bids than any competitor, a worked $180,000 remodel that looked profitable at 10.8% gross margin and actually lost money, how change orders and rework leak profit, and the bookkeeper's checklist for installing the whole system.
The margin math that makes job costing a survival skill
Construction is one of the thinnest-margin industries in the economy. Research from IBISWorld puts the average net profit margin for construction businesses between 3% and 7%, and the Construction Financial Management Association (CFMA) notes that specialty contractors typically run gross margins of 15-30% while net margins land at just 2-10%. The CFMA's benchmark surveys draw the performance line in the sand: "Best-in-Class" construction companies consistently report pre-tax net profit margins above 5%, against an industry average closer to 4.1%.
Those numbers are what make job costing non-negotiable. Consider the CFMA's own illustration: at the association's average 6.2% net profit margin for U.S. construction companies, a $5 million project produces roughly $310,000 of profit. A 10% cost overrun on that project wipes the profit out entirely. A 15% overrun turns it into a $440,000 loss. There is no company-wide "profitability" number that saves a job like that — only job-level tracking catches it in time to do anything.
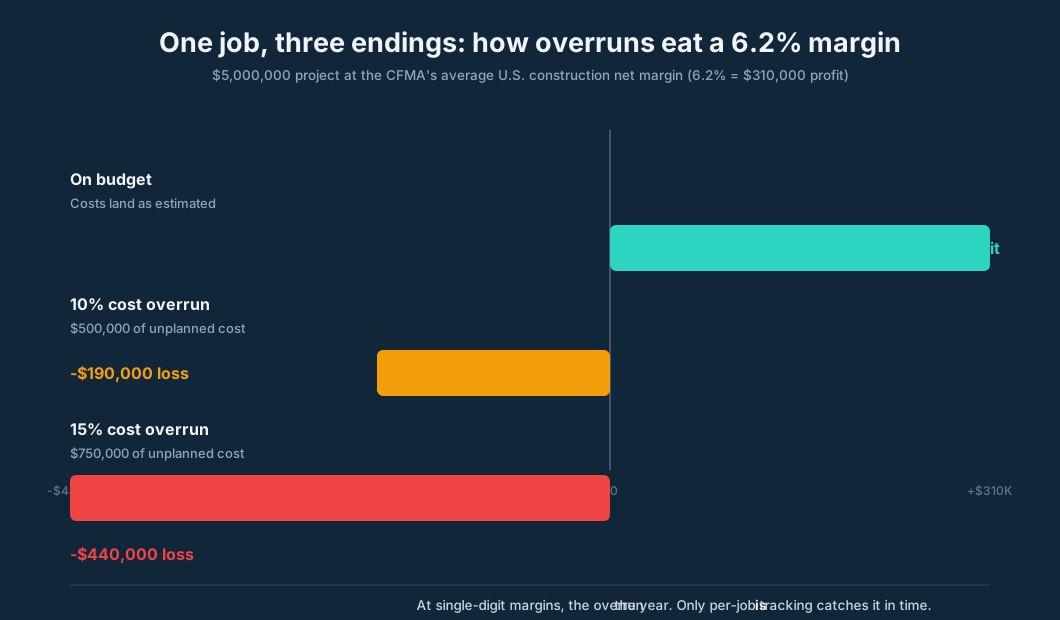
And overruns are the norm, not the exception. Research published in the International Journal of Innovation, Management and Technology found that 85% of construction projects worldwide exceed their original budgets. The McKinsey Global Institute's long-run dataset — seventy years, twenty countries — puts the average overrun at 28% of budget, climbing to 45% for mega-projects above $100 million. On the residential side, Houzz's 2026 U.S. Houzz & Home Study found 37% of remodeling projects exceeded their originally planned costs while just 3% came in under budget. A quarter of homeowners started work without any budget at all.
The pressure is not letting up, either. In a July-August 2026 survey released by the Associated General Contractors of America, construction input prices were up 7.1% year over year while the index tracking what contractors say they would charge to build a new building had risen only 3.5% — meaning contractors were absorbing the difference. More than half of surveyed members (55%) reported having projects canceled, postponed, or scaled back in the previous six months.
When margins are this thin and overruns are this common, the difference between the 4.1% average and the 5%-plus best-in-class is not better hammers. It is better numbers. A survey by Construction Research Corporation found that 75% of contractors rank job costing among their top concerns for the business. Buildertrend's 2026 industry research reports that 91% of surveyed builders track job costs in real time on at least some projects, and 86% integrate estimating directly into job costing — vendor-published survey findings rather than independent benchmarks, but they show which direction the disciplined firms are moving.
What job costing actually tracks
Job costing answers one question per job: did this job make money, and if not, where did it leak? To answer it, every cost gets assigned to a job and to a cost category — the "cost code" — as it is incurred. Five cost buckets cover essentially every contractor:
- Labor — crew wages with burden (see the next section; this is the one that kills bids).
- Materials — everything purchased for the job, including delivery, waste, and re-orders.
- Subcontractors — every sub's billed amount against their contracted price.
- Equipment — rentals, fuel, and an ownership charge for owned equipment (payment, insurance, maintenance, storage).
- Other — permits, dumpsters, inspections, bonds, travel, small tools.
Two practices separate real job costing from a P&L with job names scribbled on it. The first is committed costs: a signed subcontract or purchase order is a cost even before the invoice arrives. A job report that shows only paid invoices is weeks behind reality. The second is cost codes: bucketing everything into "materials" is fine for the tax return, but a job-cost report that separates framing lumber from finish hardware, and rough-in electrical from trim electrical, is what tells you where the next bid should change. The standard industry structure (the CSI list) goes deep; a ten-person remodeler needs ten to twenty codes, not two hundred — enough to see the leak, not so many that nobody codes correctly in the field.
The labor trap: burden is the bid you forgot
Labor is the largest direct cost on most jobs and the most commonly under-bid line item, because contractors bid the wage and forget the burden. The labor burden rate is everything an employee costs beyond the wage: employer payroll taxes (Social Security and Medicare, unemployment insurance), workers' compensation premiums, health and dental insurance, retirement contributions, paid time off, sick leave, training, uniforms, and safety equipment. In construction, the burden rate typically runs 30-45% of wages.
Do the arithmetic on one carpenter. A $30-per-hour wage at a 40% burden rate costs $42 per hour — the number that has to go into the bid, not the $30. Break it open and it looks like this:
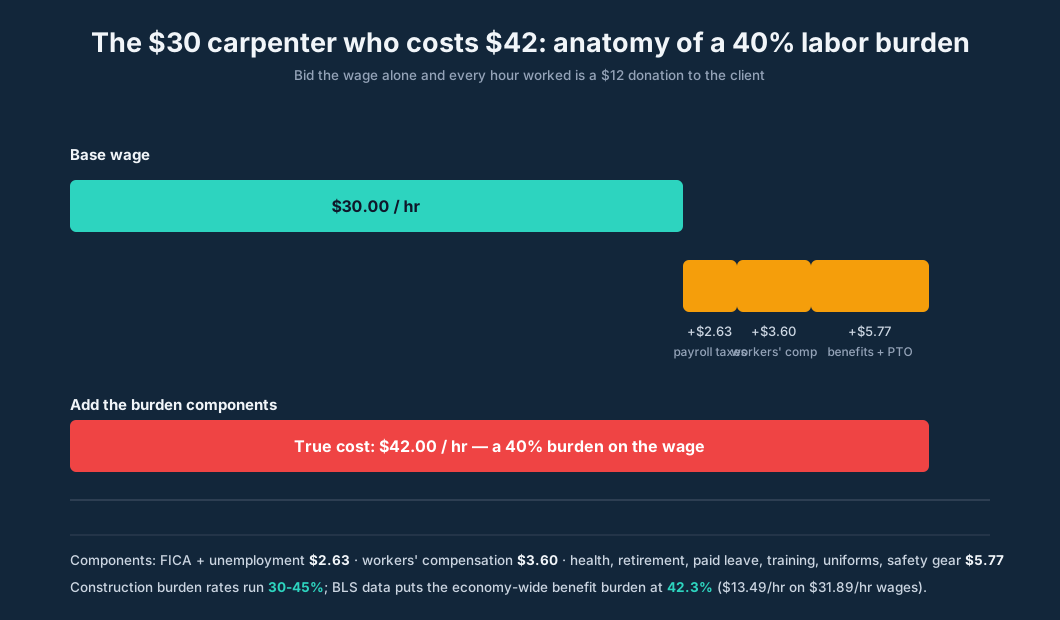
That $30 wage decomposes into roughly $2.60 of payroll taxes, $3.60 of workers' compensation, and $5.80 of benefits and paid time off — a $42 true cost. Bid the job at $30 and every hour the crew works is a $12 donation to the client. Over an 850-hour job, that single mistake is $10,200 of margin that never existed.
The national data says this burden is real, not pessimism. An analysis of Bureau of Labor Statistics data by Construction Coverage found that in 2025, total compensation cost averaged $45.38 per hour worked across the economy — $31.89 in wages and salaries plus $13.49 in benefits, a 42.3% benefit burden. The biggest components: paid leave ($3.43/hr), insurance ($3.34/hr), legally required benefits ($3.29/hr), supplemental pay like overtime and bonuses ($1.89/hr), and retirement ($1.53/hr).
The worked example: the $180,000 kitchen that lost money
Here is a kitchen remodel that bid fine, tracked fine at the company level, and lost money. Follow the numbers.
The bid. A $180,000 fixed-price contract. The estimate:
| Cost category | Estimated |
|---|---|
| Materials | $58,000 |
| Subcontractors (electrical, plumbing, tile) | $42,000 |
| Labor — burdened (850 hrs @ $40/hr) | $34,000 |
| Equipment and rentals | $6,000 |
| Permits, dumpsters, miscellaneous | $4,000 |
| Total estimated direct cost | $144,000 |
| Estimated gross profit | $36,000 (20.0%) |
A 20% gross margin at bid. Respectable. The firm also knows its overhead — office, insurance, estimator salaries, trucks — runs $240,000 a year against $2 million of revenue, a 12% overhead rate. Allocating 12% of this job's revenue as its share of overhead: $21,600. Expected net profit: $36,000 minus $21,600 = $14,400 (8.0%).
What actually happened.
| Cost category | Estimated | Actual | Variance |
|---|---|---|---|
| Materials | $58,000 | $63,500 | -$5,500 |
| Subcontractors | $42,000 | $44,500 | -$2,500 |
| Labor — burdened | $34,000 | $41,200 | -$7,200 |
| Equipment and rentals | $6,000 | $6,800 | -$800 |
| Permits, dumpsters, misc | $4,000 | $4,600 | -$600 |
| Total | $144,000 | $160,600 | -$16,600 |
| Gross profit | $36,000 (20.0%) | $19,400 (10.8%) |
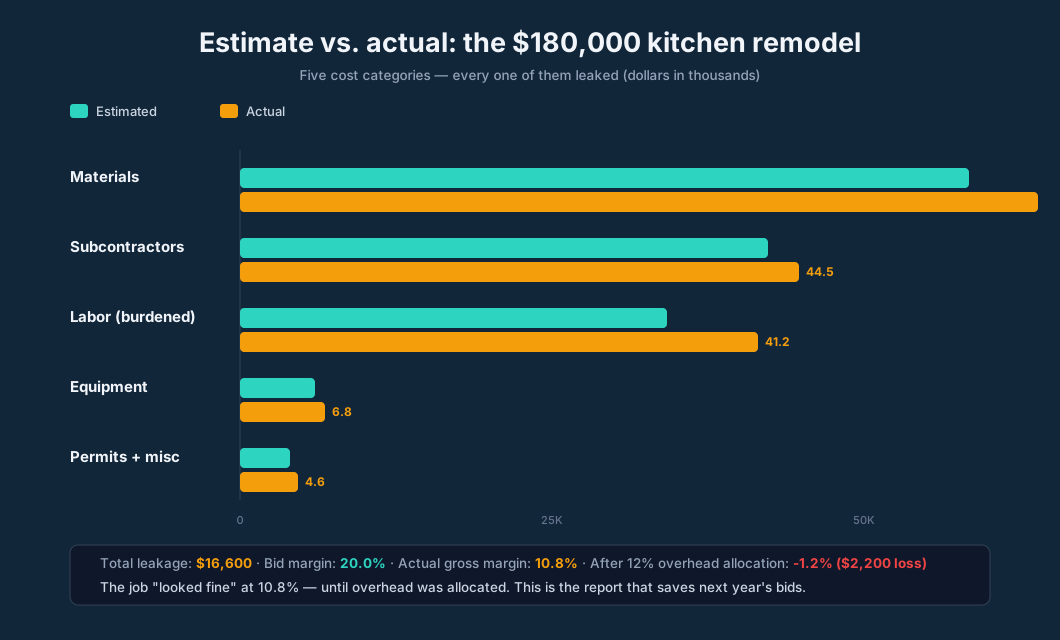
Each variance tells a story a job-cost report would have flagged mid-job, not after:
- Materials -$5,500. A lumber price increase between bid and buy, plus one full re-order of the wrong trim. Re-orders are pure waste: paying for material twice and paying labor to install the wrong thing first.
- Subcontractors -$2,500. The electrician did a change order verbally — extra recessed lights the homeowner requested on-site — and the firm priced it at the electrician's invoice instead of the change-order price, because there was no written change order. The margin on the change was donated.
- Labor -$7,200. 180 extra hours: 60 hours of rework when the tile layout had to be redone after a measurement error, 40 hours of crew standing around waiting on the delayed countertop delivery, and 80 hours of schedule creep as the job ran three weeks long. At the burdened $40 rate, every one of those hours cost real money.
The job still shows a 10.8% gross margin — which is exactly the lie company-level accounting tells. Apply the same 12% overhead allocation: $19,400 minus $21,600 = negative $2,200 (-1.2%). The job lost money. Nobody noticed until the month-end review, because nobody was reviewing per-job numbers against the budget. This is the entire argument for job costing in one example: the difference between an $14,400 winner and a $2,200 loser is a monthly report.
Change orders: the profit leak that happens by handshake
Change orders are the most common reason a well-bid job goes bad, and the least disciplined cost category in most small firms. The industry data is unambiguous: an engineering-education paper on change-order impacts notes that contract modifications increasing contract value by 5-10% are expected in most construction projects, and eSUB reports that roughly 35% of all projects experience at least one major change. A Kuwaiti study of 21 causes and 11 impacts of change orders found an average increase of 11.3% in total project cost due to change orders, with owner-driven scope changes as the most important cause.
The homeowner data tells the same story from the other side. In Houzz's 2026 study, the homeowners who blew their budgets named three reasons: 35% chose higher-end materials mid-project instead of locking them in early, 32% hit unanticipated project complexity, and 31% changed the project or design scope during construction. Every one of those is a change order on the contractor's side — and only the disciplined ones get priced and signed before the work starts.
The bookkeeper's rule for change orders has three parts:
- Nothing unpriced gets done. The price is written, signed, and tied to the job before the work starts — including the schedule impact. A change order priced at cost is a donation; the industry convention is cost plus the job's normal markup plus an administrative fee.
- Change orders are cumulative. Track the running total of change-order value as a percentage of the original contract. When cumulative changes cross 10-15% of contract value, the job is effectively a new job — the estimate is stale and the schedule needs re-baselining.
- Bill them separately. Change-order revenue gets its own invoice line items and its own cost coding, so the job-cost report shows whether changes made money or just moved money around.
Rework: paying twice for the same work
Rework — doing work, then doing it again because it was wrong, out of sequence, or built to the wrong measurements — is the cost category contractors are least honest about. The academic record is sobering. Research on 359 projects in the Construction Industry Institute database found that direct rework costs average 5% of total construction costs. A 2023 PlanRadar survey of more than 2,500 construction customers put rework at 11% of total project costs in the UK and EU, with poor communication among teams and stakeholders as the number-one cause. And Peter Love's frequently cited research in the ASCE Journal of Construction Engineering and Management found that rework contributed 52% of a project's cost growth.
On a $500,000 project, 5-11% of rework is $25,000 to $55,000 — more than most contractors' entire profit on the job. Job costing doesn't prevent rework, but it does the next most valuable thing: it makes rework visible. When the tile line on the job-cost report is 40% over budget and the variance note says "redone twice," the next bid for tile work gets a different number, and the field gets a pre-install checklist. Firms that don't code costs never learn which trade, which crew, or which detail keeps repeating — they just keep re-bidding the wrong number.
Billing types, retainage, and the WIP schedule
How a job is billed changes what the bookkeeper has to track, and each billing type has its own trap:
- Fixed price (lump sum). The bid is the revenue. The risk is entirely on the contractor's estimate — which is why this article exists.
- Cost-plus. The client pays actual cost plus a fee. The trap is documentation: every cost has to be provable, which means the job-cost report effectively is the invoice backup.
- Time and materials. Billed at agreed labor rates (burdened, plus markup) plus materials with markup. The trap is unbilled time — hours worked in the field that never make it onto an invoice.
- Unit price. Common in civil work: fixed price per unit (per linear foot, per cubic yard). The trap is quantity — the unit price assumes a quantity that the field has to measure.
On longer jobs, contractors bill by progress — a percentage of the contract as work completes — and owners typically hold retainage, a percentage of each billing withheld until the job is substantially complete. That creates three balance-sheet accounts the bookkeeper cannot skip:
- WIP asset (costs in excess of billings): work performed but not yet billed. An asset — the client owes for it.
- Overbilling liability (billings in excess of costs): cash collected ahead of the work performed. A liability — the firm owes future work for revenue already recognized.
- Retainage receivable / payable: the withheld amounts, on both sides.
The monthly WIP schedule ties these together: for each open job, contract value, costs to date, estimated cost to complete, percent complete, billings to date, and the over/under-billing position. The most important number on the schedule is not what has been spent — it is the estimated cost to complete. A $500,000 project that has cost $300,000 looks like it has $200,000 of budget left; if the remaining work will actually cost $230,000, the projected final cost is $530,000 and the job is already $30,000 over. Only a regularly updated cost-to-complete catches that while there is still time to act.
The bookkeeper's job-costing checklist
Setup (once per job):
- Create the job in the books the day the contract is signed, with its budget by cost category entered from the estimate.
- Assign a cost-code structure: ten to twenty codes covering labor, materials by phase, each subcontractor, equipment, and other. Enough to find leaks, not so many that field coding breaks down.
- Set the burdened labor rate once a year and use it on every bid and every job-cost report.
- Record committed costs (signed subs, purchase orders) the day they are committed, not the day the invoice arrives.
Monthly (before invoices go out):
- Review the estimate-vs-actual report for every open job. Any category more than 10% over estimate gets a written variance note.
- Update the estimated cost to complete for every open job and refresh the WIP schedule.
- Reconcile job-cost totals to the P&L. Every dollar of direct cost should carry a job tag; untagged costs are invisible leaks. (A common trick: a catch-all "overhead/unassigned" job so the report reconciles and the untagged number is visible.)
- Review cumulative change orders per job; price and bill any unpriced extras immediately.
Close-out (per job and quarterly):
- Run the final job-cost report within two weeks of completion: final margin, variance by category, lessons.
- Compare estimated hours to actual hours by trade and feed the differences into the next estimate's labor assumptions.
- Review profitability by job across the quarter. The firms that do this consistently find the same pattern: a small number of job types or clients produce most of the profit, and a small number produce most of the pain. The next year's marketing and bidding follows the numbers.
Where LedgerHQ fits
A word of honesty first: LedgerHQ is not a construction-specific job-costing system. It has no cost-code library, no committed-cost objects, and no change-order module. The job-cost discipline — budgets, codes, variance notes, WIP — is the firm's own system. What LedgerHQ does is give that system a clean, always-current foundation to stand on.
Classes are the job dimension. In LedgerHQ, income and expense lines can be tagged by class — location, department, property, or in a contractor's case, the job. Shared costs can be allocated across classes, and a Profit & Loss by Class report shows each job's margin side by side. That is the estimate-vs-actual report's raw material: every transaction already coded to the right job, every shared cost allocated, one report per month.
The bank feed keeps it current. Job-cost reports are only useful if actuals land promptly. LedgerHQ's bank feeds post transactions continuously, so the month-end job review works with this month's numbers, not last quarter's.
Invoicing covers progress billing. Contractor progress billings, change-order invoices, and retainage releases all go out as invoices from LedgerHQ — created, sent, tracked, and collected in one place, with live open and overdue balances per customer so slow-paying owners are visible before they become cash-flow problems.
The evidence stays attached. Every transaction can carry its source document beside it — the sub's invoice, the change-order authorization, the delivery ticket. When the owner questions a cost-plus invoice or the CPA asks for backup, the proof is already on the transaction.
Tally reviews the numbers like a CFO. The AI bookkeeper asks for statements, documents, and explanations, keeps the source beside every transaction, and surfaces the anomalies — the uncategorized costs, the missing invoices, the job bleeding hours — before the month-end review. The bookkeeper still makes the judgment calls; Tally does the combing.
LedgerHQ is $20 per month per business, and new businesses run on a Free Preview through January 1, 2027 — which means a contractor's bookkeeper can set up the class structure, run a full month of per-job reporting, and show the owner the first estimate-vs-actual report before the firm spends anything.
The bottom line
The contractor who doesn't job-cost is not managing a business; he is running a raffle with power tools. At 6.2% net margins against 28% average overruns, the industry does not forgive jobs that aren't measured. The firms at the top of the CFMA benchmarks are not there because they work harder — they are there because every job gets a budget, every cost gets a code, and every month the numbers get read. Install the checklist, hold the monthly review, and let the losers teach the next bid. That is job costing. It is not complicated. It is just rare.
FAQ
What is job costing in construction? Job costing is tracking all costs — labor (with burden), materials, subcontractors, equipment, and other costs — against the individual job they belong to, compared against the job's budget. It produces an estimate-vs-actual report per job so the contractor knows which jobs made money and where the leaks are.
What is a good gross margin per job for a contractor? At bid, residential contractors commonly target 20-30% gross margin per job, with net margins after overhead of 5-10%. Industry data puts average net margins at 3-7% (IBISWorld) to 6.2% (CFMA), so a job that "looks fine" at 10% gross can lose money after overhead allocation.
How do you calculate labor burden for a bid? Add up all employment costs beyond the wage — employer payroll taxes, workers' comp, health insurance, retirement, PTO, training, uniforms — and divide by total wages. Construction burden rates typically run 30-45%. A $30/hr wage at 40% burden is a $42/hr bid cost.
What are committed costs in job costing? Costs the contractor is legally committed to but hasn't paid yet — signed subcontracts, issued purchase orders. A job-cost report that shows only paid invoices understates true job cost by weeks. Record commitments the day they're signed.
How often should a contractor review job costs? At minimum monthly, before progress invoices go out; weekly on large or troubled jobs. Each review compares estimated vs. actual by cost category, updates the estimated cost to complete, and refreshes the WIP schedule.
What is a WIP schedule? A Work-in-Progress schedule lists every open job with its contract value, costs to date, estimated cost to complete, percent complete, and billings to date — showing whether each job is over- or under-billed. It's the core monthly report for any contractor with jobs spanning more than one accounting period.
Do small contractors really need job costing? The smaller the contractor, the more each job matters. A ten-job-a-year remodeler who loses money on two jobs has lost 20% of annual volume. Company-level books hide this; per-job tracking reveals it.
Sources
- Construction Financial Management Association, "Construction's Lifeline: Key Metrics for Measuring Financial Health" — cfma.org (IBISWorld 3-7% net margin data). https://cfma.org/articles/construction-s-lifeline-key-metrics-for-measuring-financial-health
- Construction Financial Management Association, "Margin Erosion in a High-Inflation Environment: How Specialty Contractors Can Fight Back" — cfma.org (specialty contractor gross 15-30%, net 2-10%; job costing as margin tactic). https://cfma.org/articles/margin-erosion-in-a-high-inflation-environment-how-specialty-contractors-can-fight-back
- oTechWorld, "How to Reduce Cost Overruns" (85% of projects over budget per IJIMT; 28% average overrun per McKinsey 70-year dataset; CFMA 6.2% average net margin, $5M job math). https://otechworld.com/how-contractors-can-reduce-cost-overruns-on-construction-projects/
- Goodwin Construction, "Why Commercial Construction Projects Go Over Budget" — goodwin-gc.com, May 2026 (nine of ten projects overrun; typical projects 16% over per Propeller Aero). https://goodwin-gc.com/2026/05/12/commercial-construction-cost-overruns-washington-state/
- Buildertrend, "What's a Healthy Net Margin for $10M+ Builders?" — buildertrend.com, September 2026 (2026 State of Residential Construction Industry: 9.0% median net margin, 25% median markup for $10M+ builders). https://buildertrend.com/blog/gross-margin-for-10-home-builders/
- NAHB 2026 Remodelers' Cost of Doing Business Study, via Door & Window Market Magazine — dwmmag.com, April 24, 2026 (remodeler net margin 6.3%, gross 29.9% in 2024). https://www.dwmmag.com/2026/04/24/study-shows-profitability-for-remodelers-reaching-highest-level-in-nearly-30-years/
- Foundation Software, "The Secrets to Job Costing" (Construction Research Corporation survey: 75% of contractors rank job costing a top concern). https://www.foundationsoft.com/learn/the-secrets-to-job-costing/
- ConstructionPlacements, "12 Best Construction Job Costing Software for Contractors in 2026" — constructionplacements.com, October 7, 2026 (Buildertrend 2026 research: 91% track job costs in real time on some projects; 86% integrate estimating into job costing; vendor-published survey). https://www.constructionplacements.com/construction-job-costing-software/
- Cantech Letter, "What is a burden rate in construction?" — cantechletter.com, December 2024 ($30/hr wage at 40% burden = $42/hr true cost). https://www.cantechletter.com/2024/12/what-is-a-burden-rate-in-construction/amp/
- Bizky, "Labor Burden: What Is It and How to Calculate It Accurately" — bizky.ai (construction burden rates 30-45%). https://bizky.ai/blog/labor-burden-what-is-it-and-how-to-calculate-it-accurately/
- Hazard Herald / Construction Coverage analysis of BLS data, "Beyond Wages: The Total Cost of Employing Workers in the U.S." — hazard-herald.com, August 27, 2025 ($45.38/hr total compensation; 42.3% benefit burden). https://www.hazard-herald.com/news/national/beyond-wages-the-total-cost-of-employing-workers-in-the-u-s/collection_8b90978b-ef1a-56b5-a5a7-0e28c851971a.html
- Thomas, Haas & Caldas, "Measuring the Impact of Rework on Construction Cost Performance," via Construction Industry Institute database (direct rework costs average 5% of total construction costs, 359 projects). https://citeseerx.ist.psu.edu/document?doi=f535dd642e59413505315bb9358502a0d143765e&repid=rep1&type=pdf
- PlanRadar, "The true cost of rework in UK and EU construction," via Premier Construction News — premierconstructionnews.com, June 16, 2023 (rework 11% of project costs; poor communication #1 cause). https://premierconstructionnews.com/2023/06/16/the-true-cost-of-rework-in-uk-and-eu-construction/
- Peter E. D. Love, "Influence of Project Type and Procurement Method on Rework Costs," Journal of Construction Engineering and Management 128(1) — ascelibrary.org, 2002 (rework contributed 52% of project cost growth). https://ascelibrary.org/doi/10.1061/%28ASCE%290733-9364%282002%29128%3A1%2818%29
- eSUB, "Stop Losing Money When Creating A Change Order" — esub.com, February 2025 (~35% of projects experience at least one major change). https://esub.com/blog/stop-losing-money-on-change-orders
- Homaid et al. / Rashid et al. 2012, "Causes and Effects of Change Orders on Construction Projects in Kuwait," via SlideShare (11.3% average total cost increase from change orders). https://www.slideshare.net/slideshow/causes-and-effects-of-change-orders-on-construction-projects-in-kuwait/38855308
- Houzz 2026 U.S. Houzz & Home Study, via GoPressTimes — gopresstimes.com, ~August 2026 (37% of projects over budget; 3% under; top overrun causes). https://gopresstimes.com/premium/stacker/stories/new-data-shows-early-planning-is-reshaping-home-remodeling-outcomes,345804
- AZ Big Media, "Why commercial construction costs are outrunning bid prices" — azbigmedia.com, ~September 2026 (AGC survey: input prices +7.1% vs bid index +3.5%; 55% had projects canceled/postponed/scaled back). https://azbigmedia.com/real-estate/commercial-real-estate/construction/why-commercial-construction-costs-are-outrunning-bid-prices/
- LiveFlow, "Construction Chart of Accounts Template for Excel" — liveflow.com, 2026 (job costing COA structure; WIP, retainage, overbilling accounts). https://liveflow.com/blog/construction-chart-of-accounts-template-for-excel-the-complete-contractor-coa-playbook
- CrewCost, "Mastering Construction Job Costing for Emerging Contractors" — crewcost.com (Builder's Feedback Loop: bid, build, measure, improve). https://crewcost.com/blog/mastering-construction-job-costing/
- LedgerHQ Docs, "Accounting And Reports" help collection — ledgerhq.pro (Track classes and report profit by class: tag income/expense lines, allocate shared costs, P&L by Class; invoicing). https://ledgerhq.pro/docs/help/collections/accounting-and-reports